Making an important decision is easier when all of the information you need is within reach.
If that information reflects what’s happening in real time, you can base your decisions on the most up to date findings and factors, which can help you streamline operations, improve services, and magnify your organization’s impact.
On the other hand, information that’s printed on paper or gathered and organized in multiple software tools won’t help when you need to call the shots quickly.
Check it out…
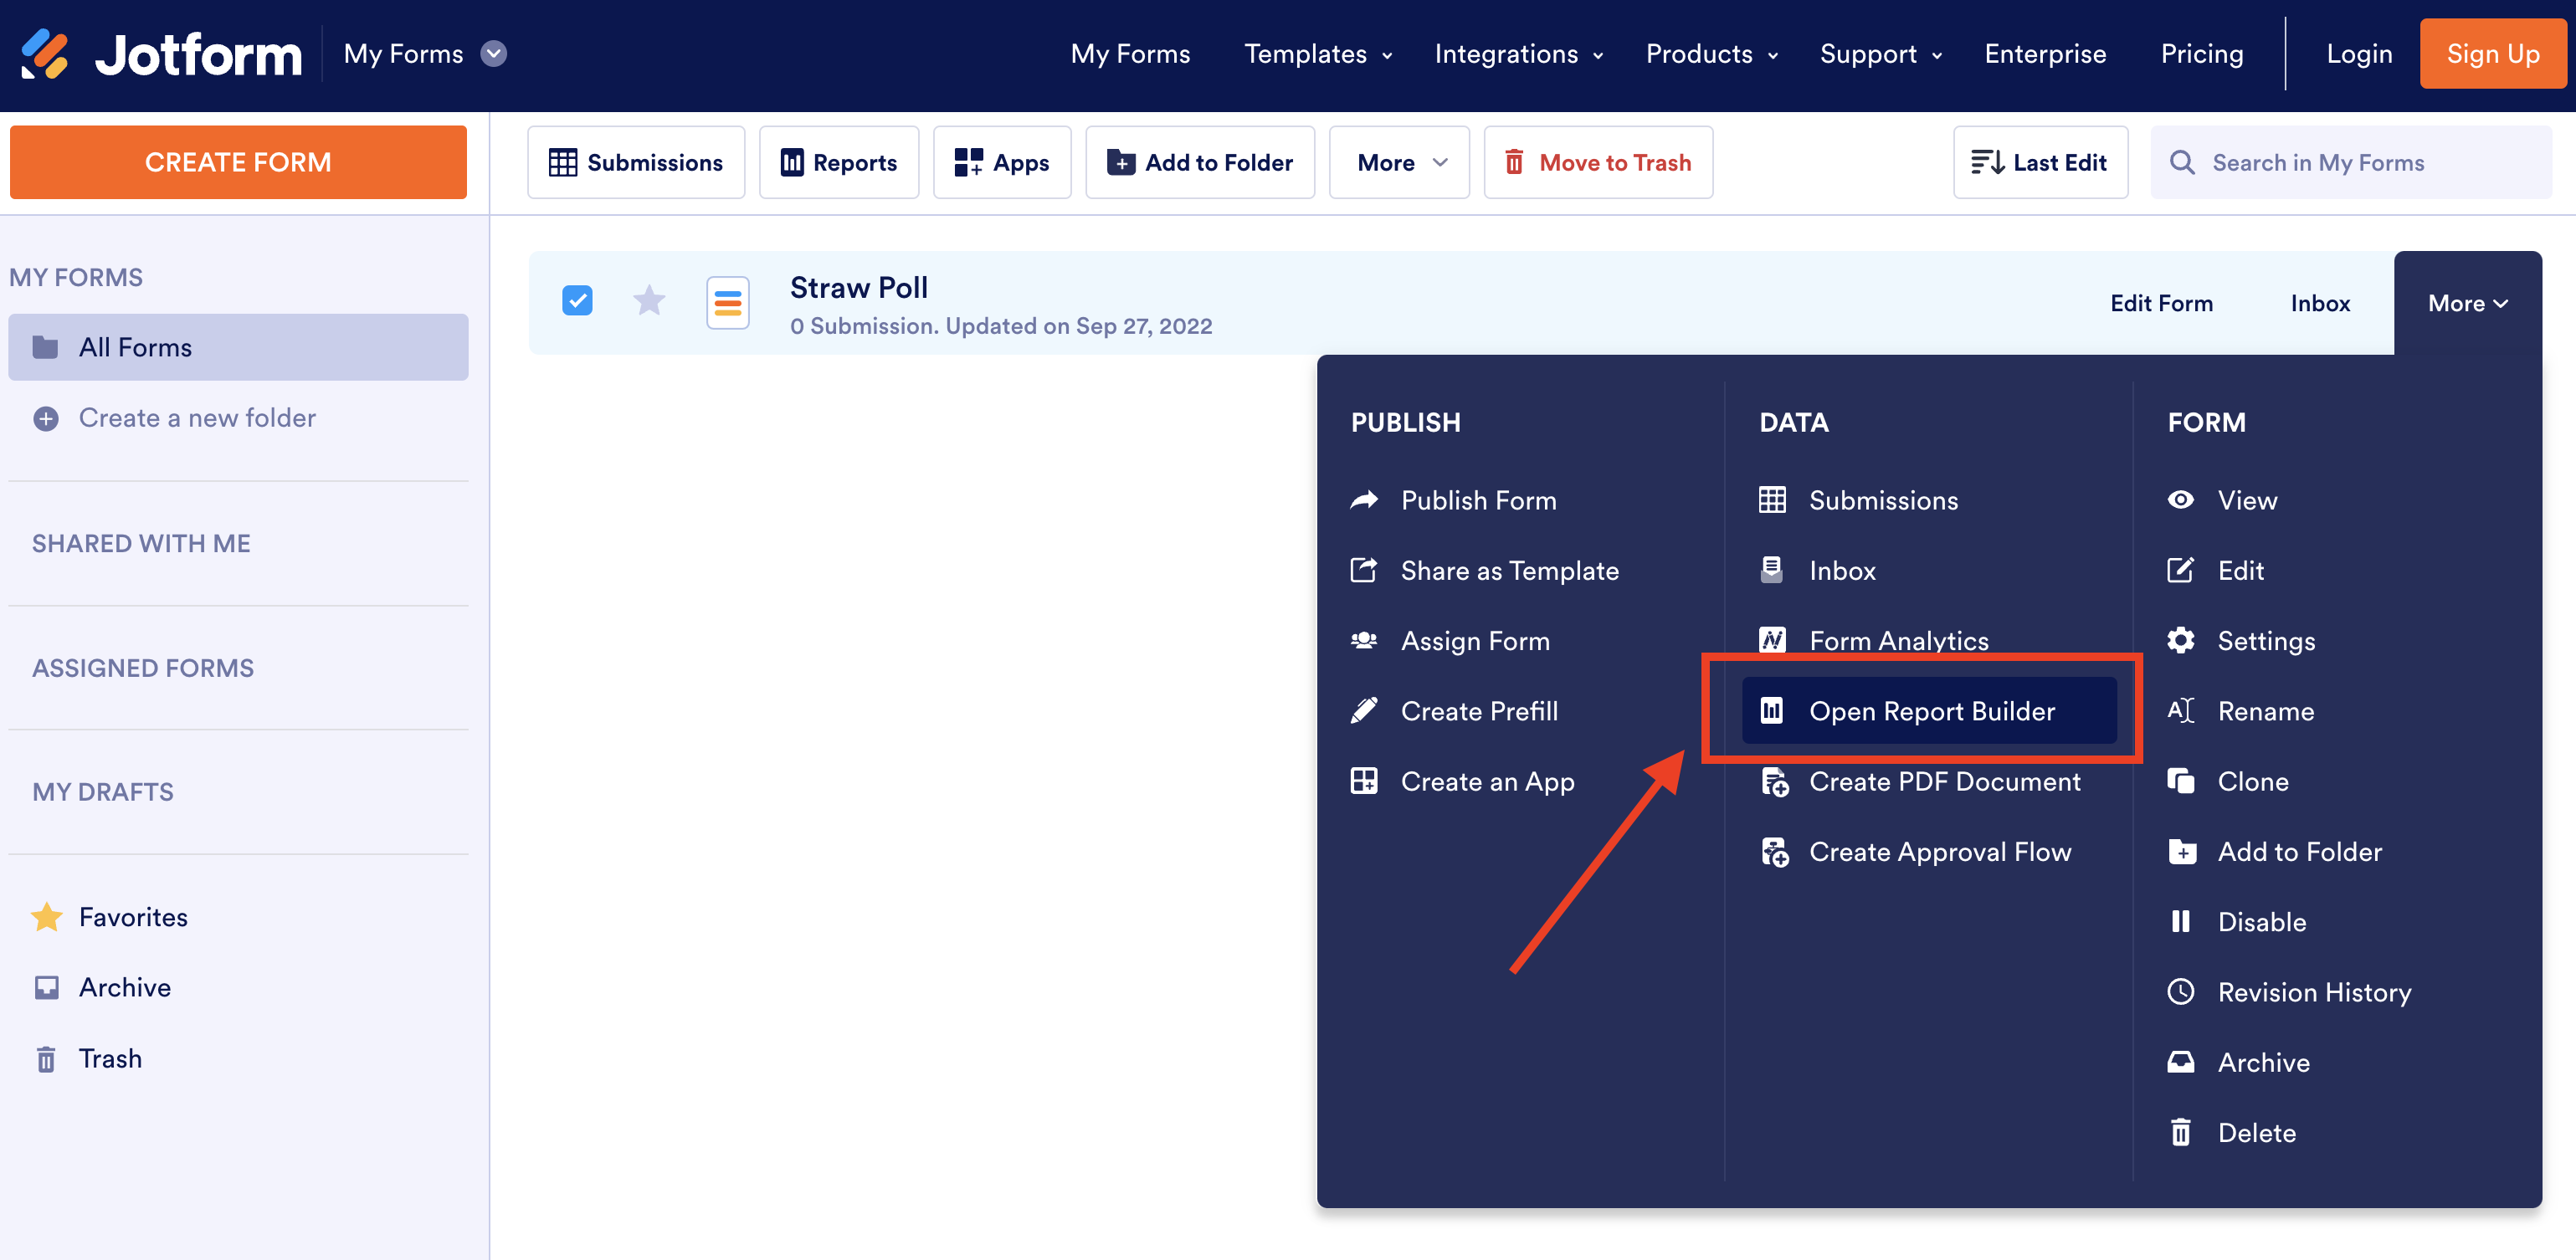
Turn your form data into a live analytics dashboard with Jotform Report Builder. It auto-updates with each new submission!
Jotform Report Builder can instantly turn submitted data from online forms into live dashboards that show where everything stands at any given time so you can take action when any changes or issues arise.
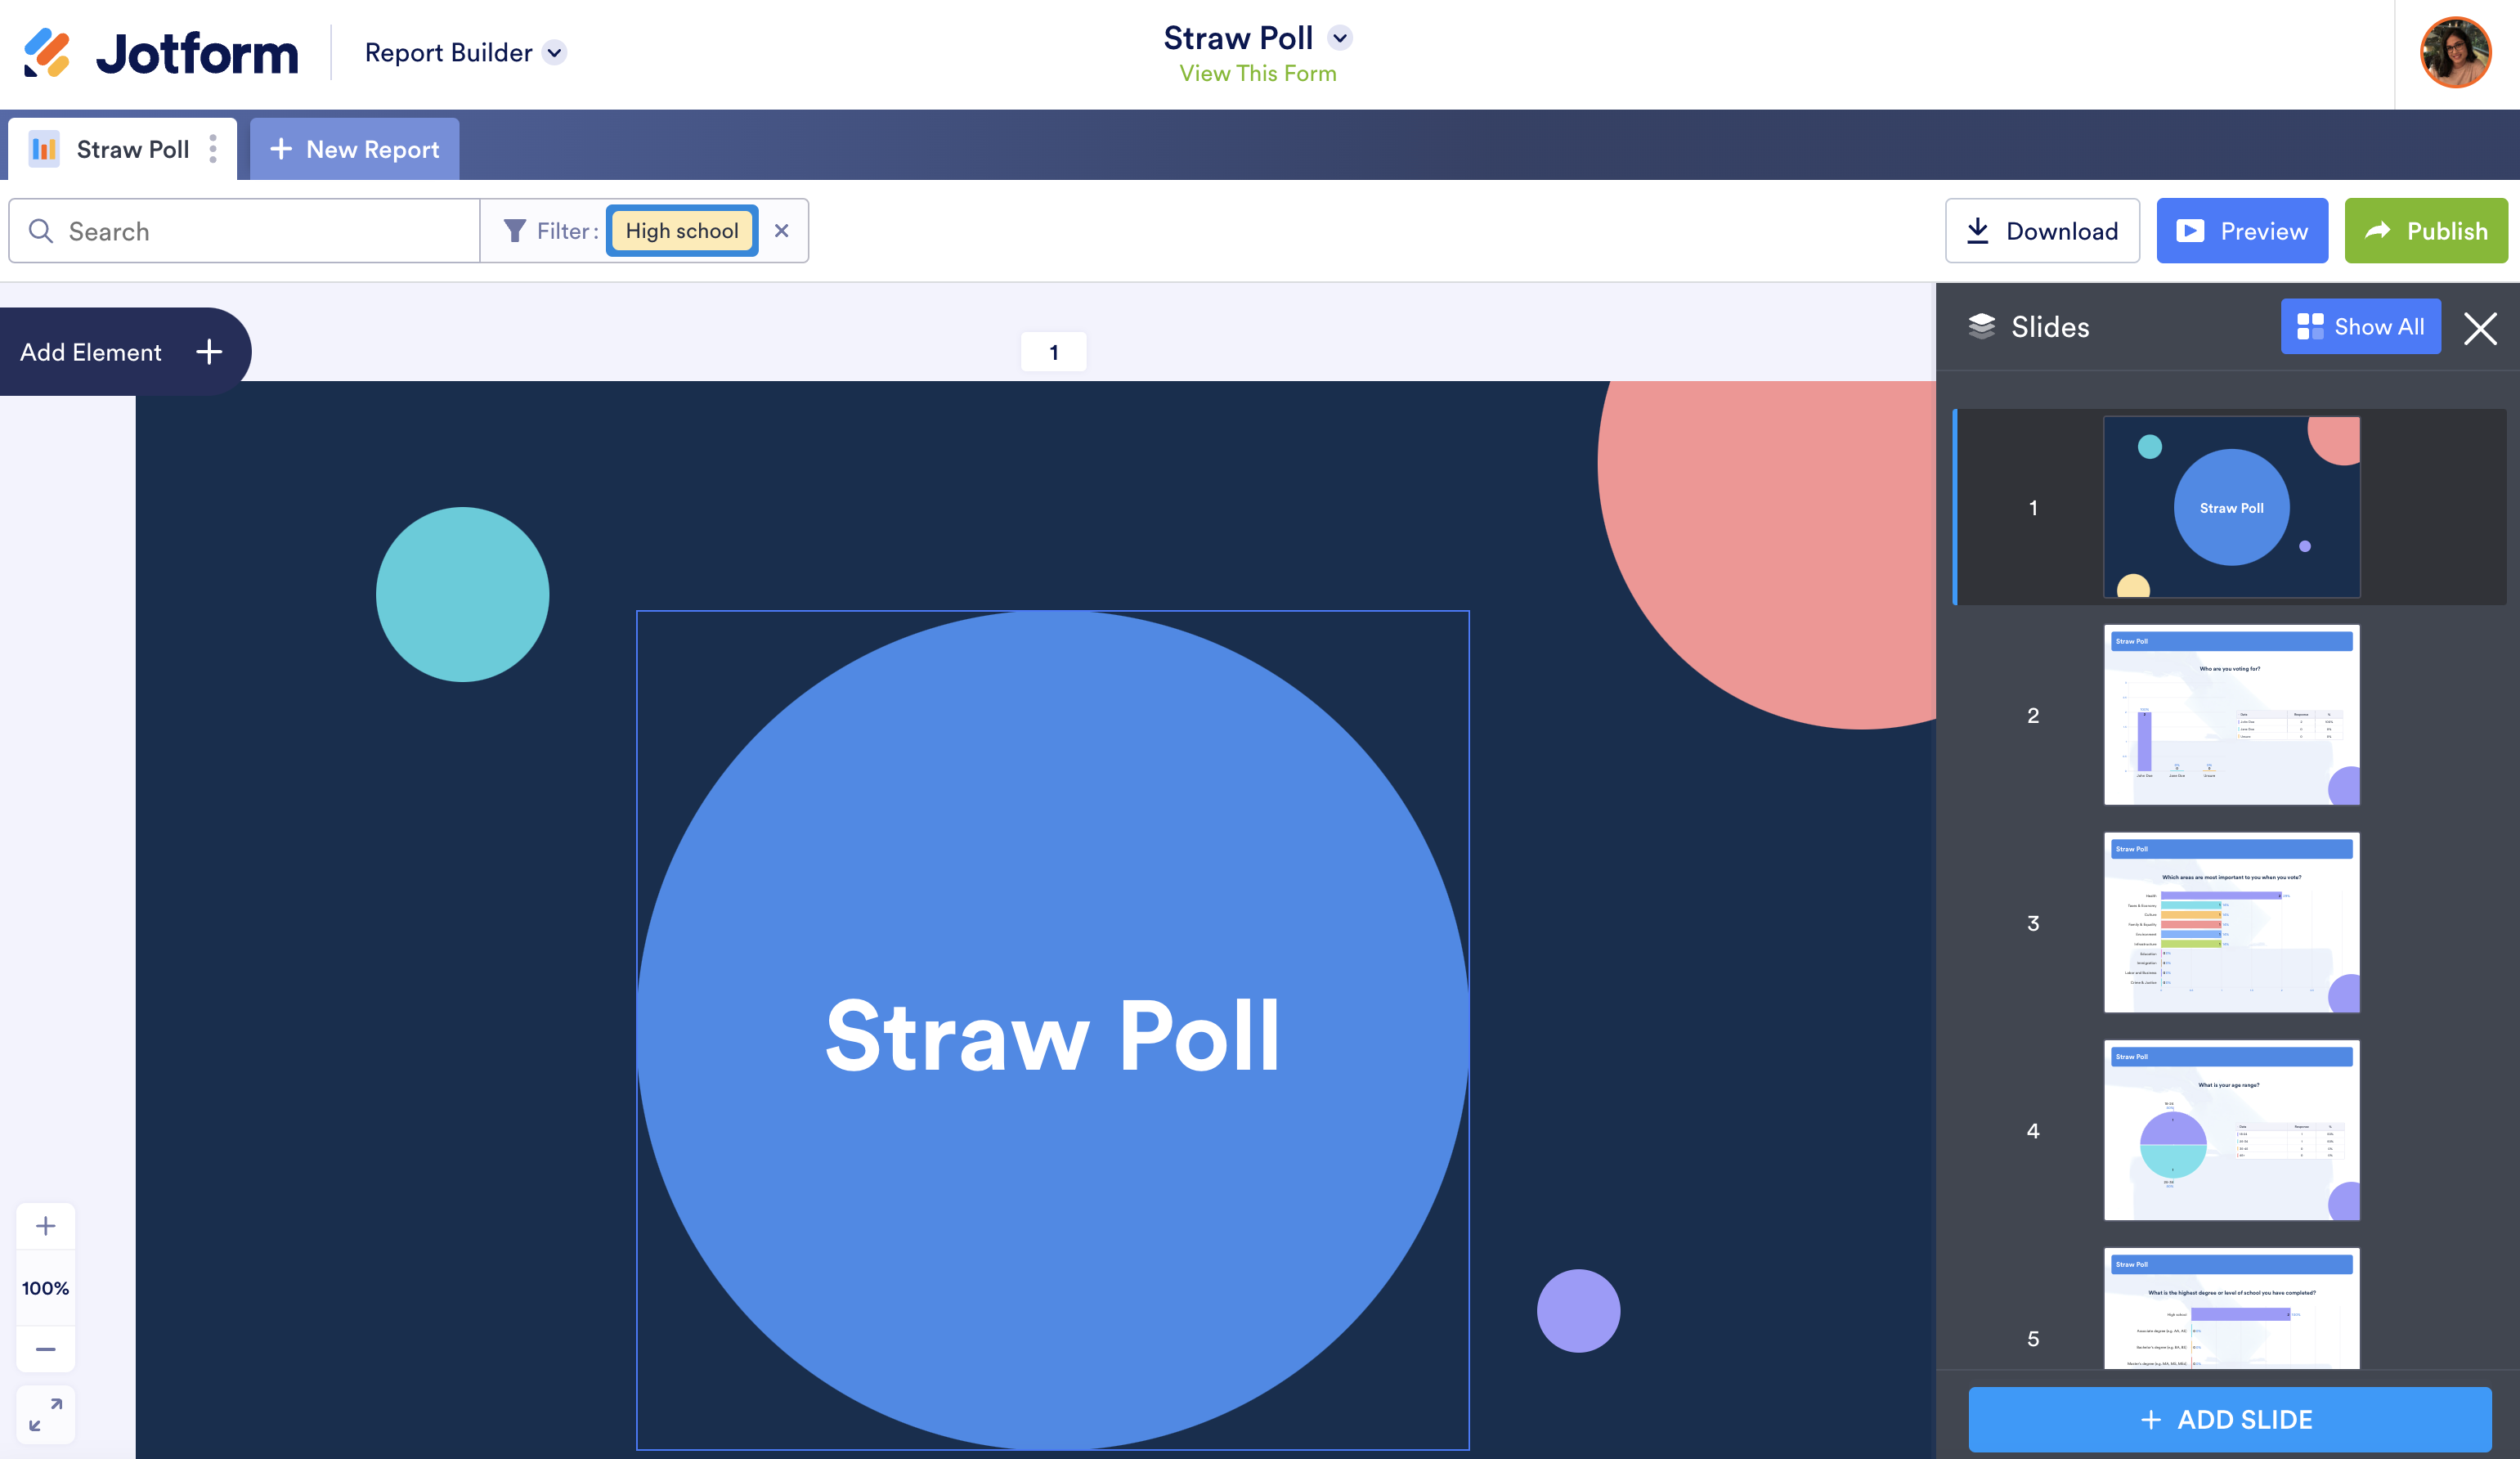
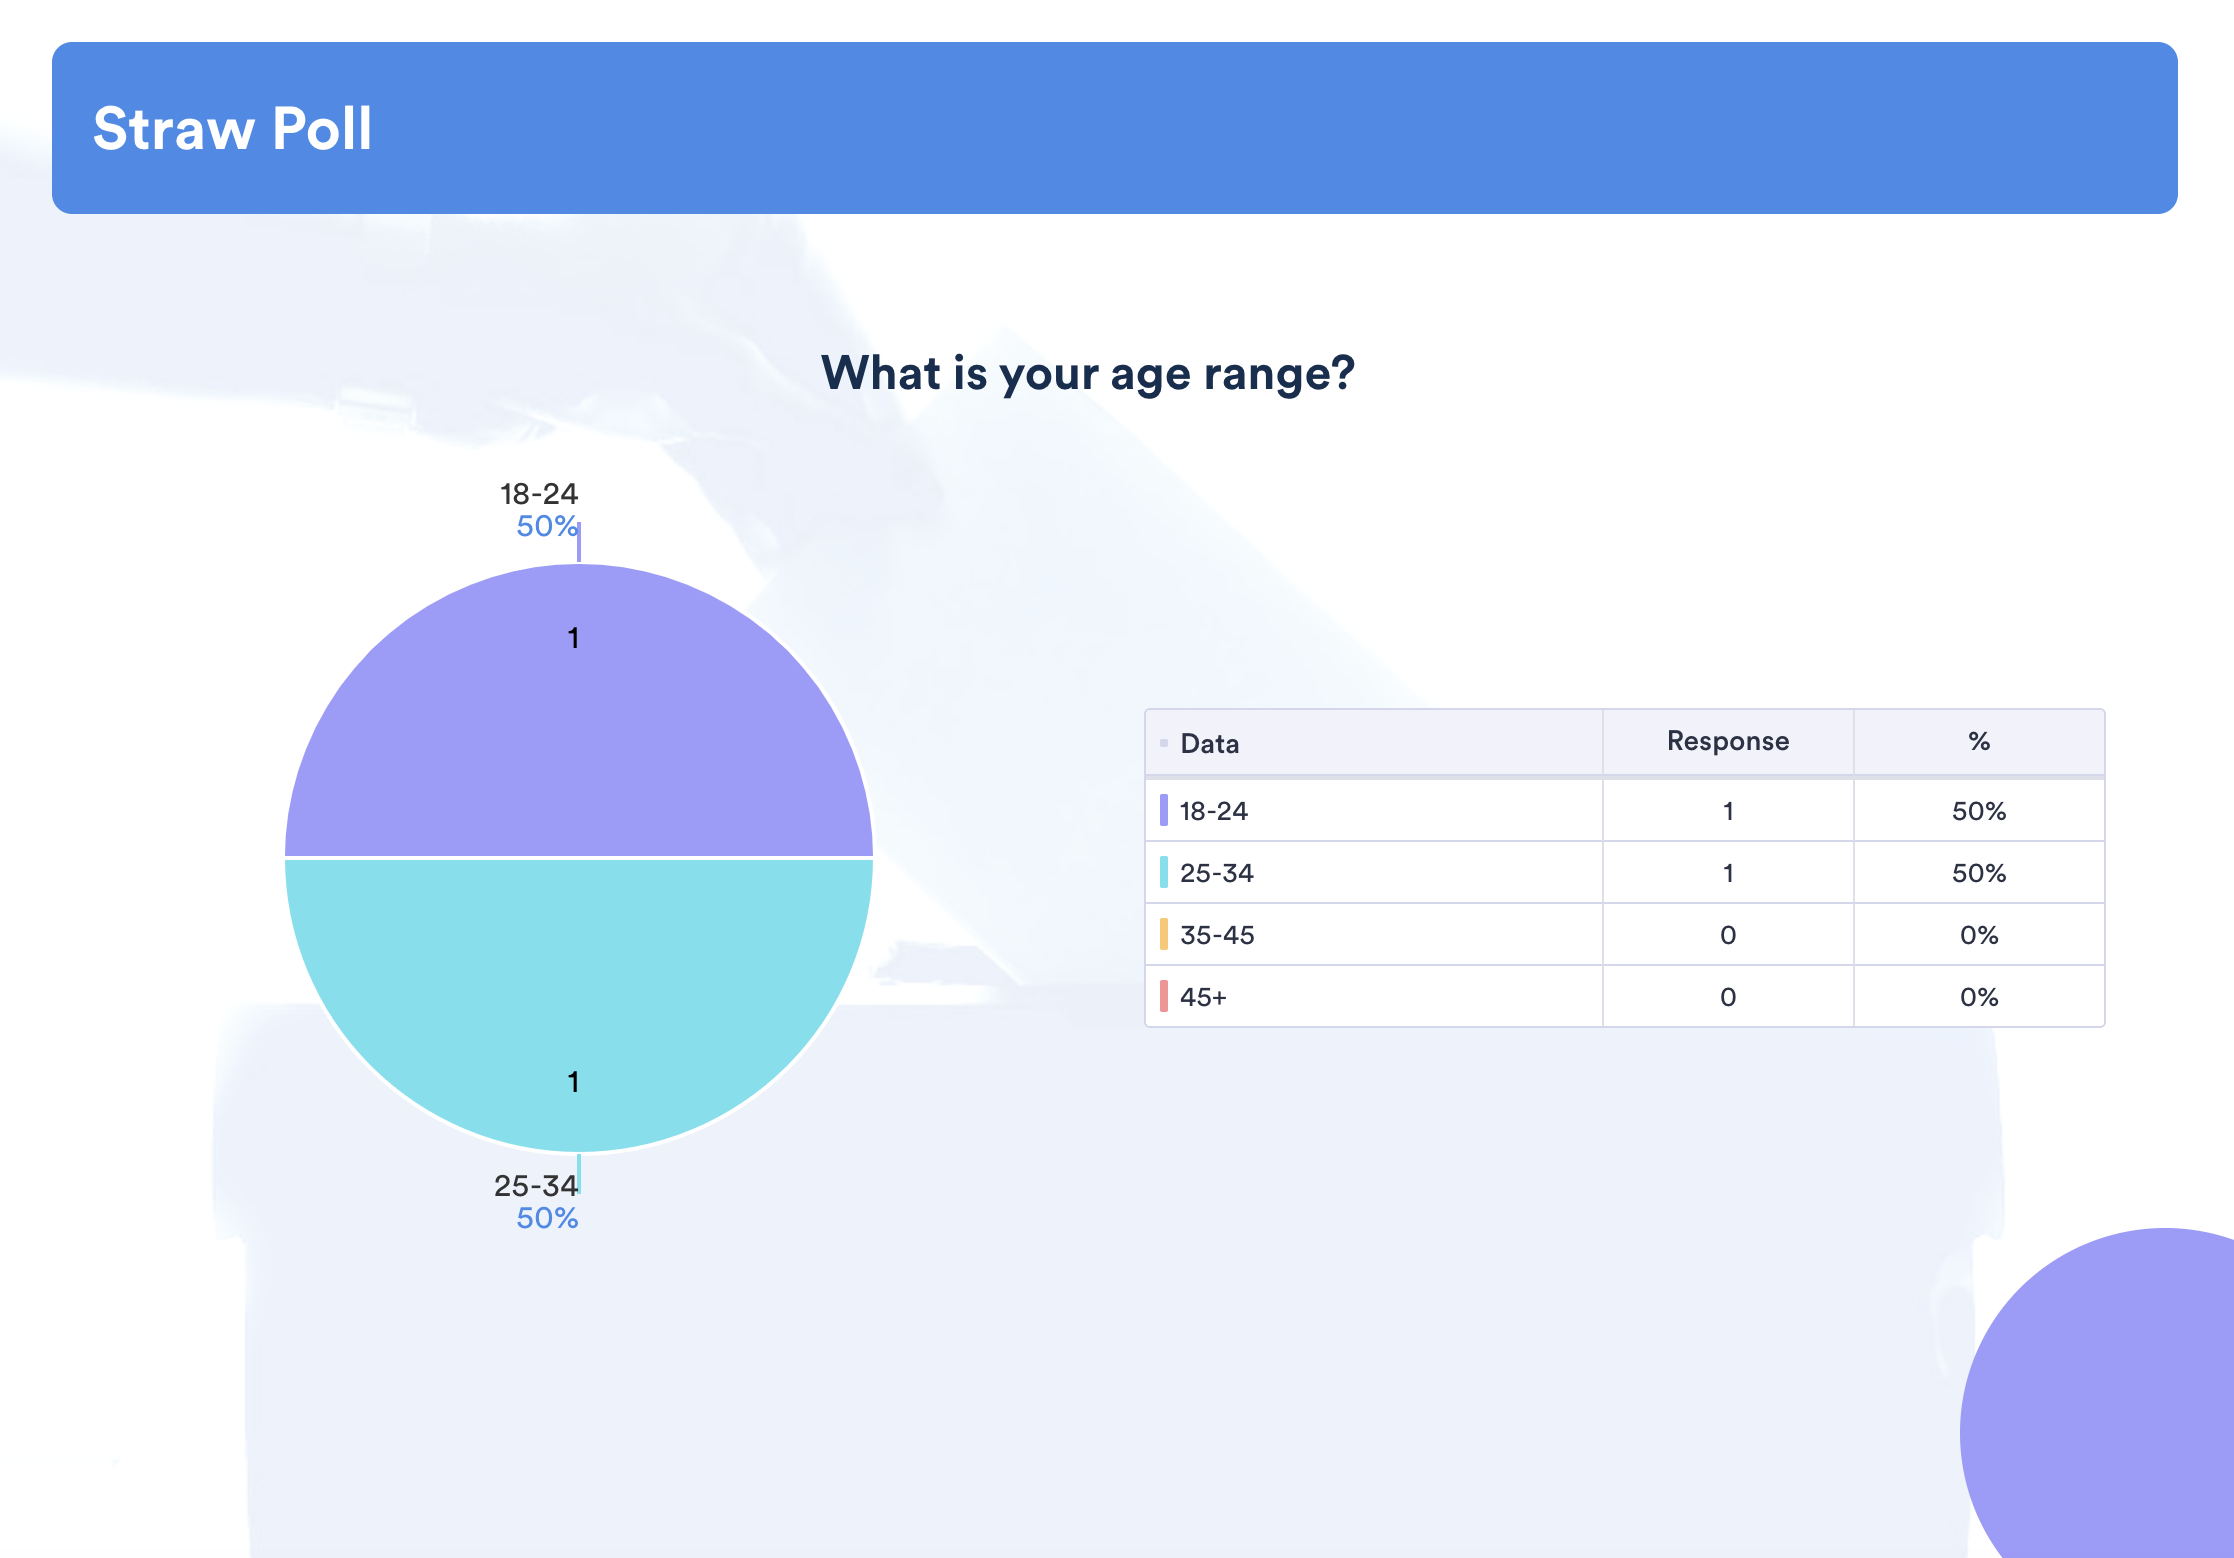
Once people fill out one of your online forms and submit their responses, Jotform Report Builder can create attractive and thorough reports that display this data as charts or graphs within a matter of seconds.
If you want to give your report a personal touch, Jotform Report Builder has all the design tools and options you need to create a report from scratch.
Jotform Report Builder also makes it easy to print your report, share a dedicated link to it, send the link in a customizable email, or embed it on a website. You can even control who is able to view your reports, what they can do with them, and whether access should be cut off after a certain period of time.
When someone fills out the online form linked to your report, the charts and graphs that display data will be updated automatically.
Anyone who can view the report on your website or access it using a dedicated link will be able to see this updated data. That means you no longer need to manually update information, generate a new report, and reshare it with everyone who needs your data.
With Jotform Report Builder, you can use information, such as poll data or incident reports, collected from workers out in the field to create customizable reports that provide a bird’s-eye view of your entire operation. This means you can readily identify key trends, monitor areas of concern, stay on top of new developments, and respond to key changes.
For instance, reports generated from coronavirus forms allow you to determine where additional resources may be needed, how positivity rates are changing, and which groups of people are experiencing higher infection rates. Data from employee incident reports, meanwhile, shows you where accidents happened and when they took place, so that you can decide what to do to prevent these accidents in the future.
Conclusion
Instead of basing strategic decisions on outdated data or spending hours gathering and organizing it, Jotform Report Builder enables you to evaluate your organization’s performance at any point in time, identify any issues, and respond to them quickly.
Whether you’re reallocating resources, taking stock of your operations, closing gaps in services, or directing an extra set of hands to the right place, Jotform Report Builder organizes, analyzes, and succinctly lays out the collected data that’s needed to drive these critical decisions.
Haven’t tried Jotform Report Builder yet?
Give it a whirl today! See how we can help you stay on top of your business, do more with your collected form information in less time, and make data-driven decisions on the fly.


Send Comment: