No matter the type of business you own, every task has its own detailed process. And as your company grows, so does the amount of input from managers, stakeholders, customers, and employees. That’s what makes mapping out these processes from start to finish, making it clear what is required and when, so essential.
But while we can all agree that efficient project management is necessary, few organizations can actually claim to do it well. For example, according to a 2019 Global Outlook report only 19 percent of surveyed businesses claim to “deliver successful projects at least most of the time.” Even worse, less than half of projects are recorded to have met stakeholder satisfaction.
Whether poor organization or a lack of resource centralization was to blame here, it’s clear that as your projects become more nuanced and elaborate, your process maps should follow suit. Over the next few chapters, we’ll explore how and why to deploy these strategies — plus the ways you can use them to your advantage as you tackle projects.
What is process mapping?
Process mapping evolved from the historically popular flowcharting, which was designed by productivity-obsessed business magnate, Frank Gilbreth, in the 19th century.
Nowadays, process mapping is the visual representation and explanation of each stage in a process — this can range from basic process lists, to more complex value stream maps and business process model and notation (BPMN) diagrams.
On the surface, process mapping may seem like an obvious practice for project managers — but these charts can go beyond just the simple tools for checking steps in a process. They’re instrumental in providing visual context to your entire business, improving documentation, and giving detailed instruction to the necessary team members.
How to read a process map
At all levels, process mapping involves using specialized flowcharts, both visual representations and malleable tools for project management. In these, symbols lend weight to each phase of a process, making it easier to translate these charts to your teams.
Process mapping symbols are relatively straightforward and universal to the templates you’ll see and develop on your own:
- Ovals: Denote the opening and closing phases of a process.
- Rectangles: Show a step in the workflow.
- Arrows: Connect each step in the process.
- Diamonds: Indicate where a decision is needed to move the process forward.
This is one of the more rudimentary uses of visualization in process mapping, though complex visual guides can provide even more terminology to your flowcharts.
Get up to speed on process mapping
Throughout the next few chapters, we’ll go into detail about the various types of process mapping you can apply to your business, examples of them in action, and how Jotform can help you put one together.
So by the end, you should be ready to deploy a new and improved process map in your next big project.
The benefits of process mapping
We’ve already explored the fundamentals of building process maps and creating visuals that help manage and develop your projects. But beyond these obvious improvements, what does process mapping do? And what tangible results can you expect to see?
Define roles clearly
A process map is a clear picture of how employees should complete a task or project. For example, consider an external request or complaint made to a customer service team.
This process map might include the following
- Register the complaint on the internal database.
- The original recipient attempts to resolve it.
- If unable, elevate to management.
- Management may issue refunds, rewards, or special offers.
- Follow up with the customer in one week.
The assignments of various roles are solidified by the incorporation of a process map, making for both a smoother customer experience, and clear internal procedure.
Document the full process
The maps you build to spell out your business practices are a resource you can hand off to a team or use to onboard a new starter — that’s the beauty of careful documentation!
On top of just being a valuable blueprint, documenting processes also gives you a time capsule of your business processes for reference as you grow. So if your customer service team were picking up negative customer feedback about the length of the complaints process, you can easily implement changes:
- Register the complaint on the internal database.
- Allow the original recipient to issue refunds, rewards, or special offers.
- Follow up with the customer in one week.
Remember to keep asking questions to facilitate regular improvement. For example, what about your current process is different from previous formats? What did you attempt to simplify that erased a vital portion of the mapping process? Is there an assigned task or role that’s best suited to another department or individual?
Promote efficiency
The whole purpose of creating repetitive workflows and automating tasks is to make your efforts as efficient as possible. With process maps, you can identify which tasks can be automated or delegated elsewhere.
For instance, in the case of our customer service team, perhaps an AI chatbot could speed up the whole complaint process, and free your staff up for more valuable tasks:
- Register the complaint on the internal database.
- Direct customer to AI chatbot to resolve the complaint and request refund.
- Follow up with the customer in one week.
Remember, efficiency does not mean putting a process all on one person. In fact, media multitasking results in decreased performance among professionals in the workplace.
Streamline problem-solving
The more you can flesh out the visual structure of your processes, the more you can streamline how you approach problems.
Think of what process mapping helped accomplish in our customer service request example. If your customers are responding that they feel the process is too impersonal, your process map gives you a good idea of how to solve it:
- Register the complaint on the internal database.
- Begin the complaint resolution process with AI chatbot to record details.
- Escalate to a real customer service representative to resolve.
- Follow up with the customer in one week.
By keeping detailed records of all your processes, you no longer have to think of problem-solving through the myopic lens of asking each department for a solution. Instead, you’ll have the complete representation of work at your disposal to help you make an informed decision.
Which type of process map is right for you?
Process mapping is not a one-size-fits-all solution. Sometimes, more simple tasks require basic linear maps, while larger projects deserve more complex tiers of organization to ensure clarity.
Process maps don’t even have to be two-dimensional, with some firms experimenting with 3D modelling for easier visibility. Whatever the case, you have the flexibility to work with a mixture of these tools — so read on to discover their many formats.
High-level process mapping
High-level mapping is the starting point for many organizations. These maps can broadly refer to the standard linear workflows that spell out basic processes depending on the context in which you use them — they can also be derivatives of suppliers, inputs, process, outputs and customers (SIPOC) maps.
For example, this is a high-level process map showing the steps needed in order to enrol and supply an incoming student with the proper course materials. The map contains big-picture information about what needs to occur in each phase of the process, plus clear direction at the decision points. These features make it an easily shareable document that should translate well to other teams.
SIPOC mapping
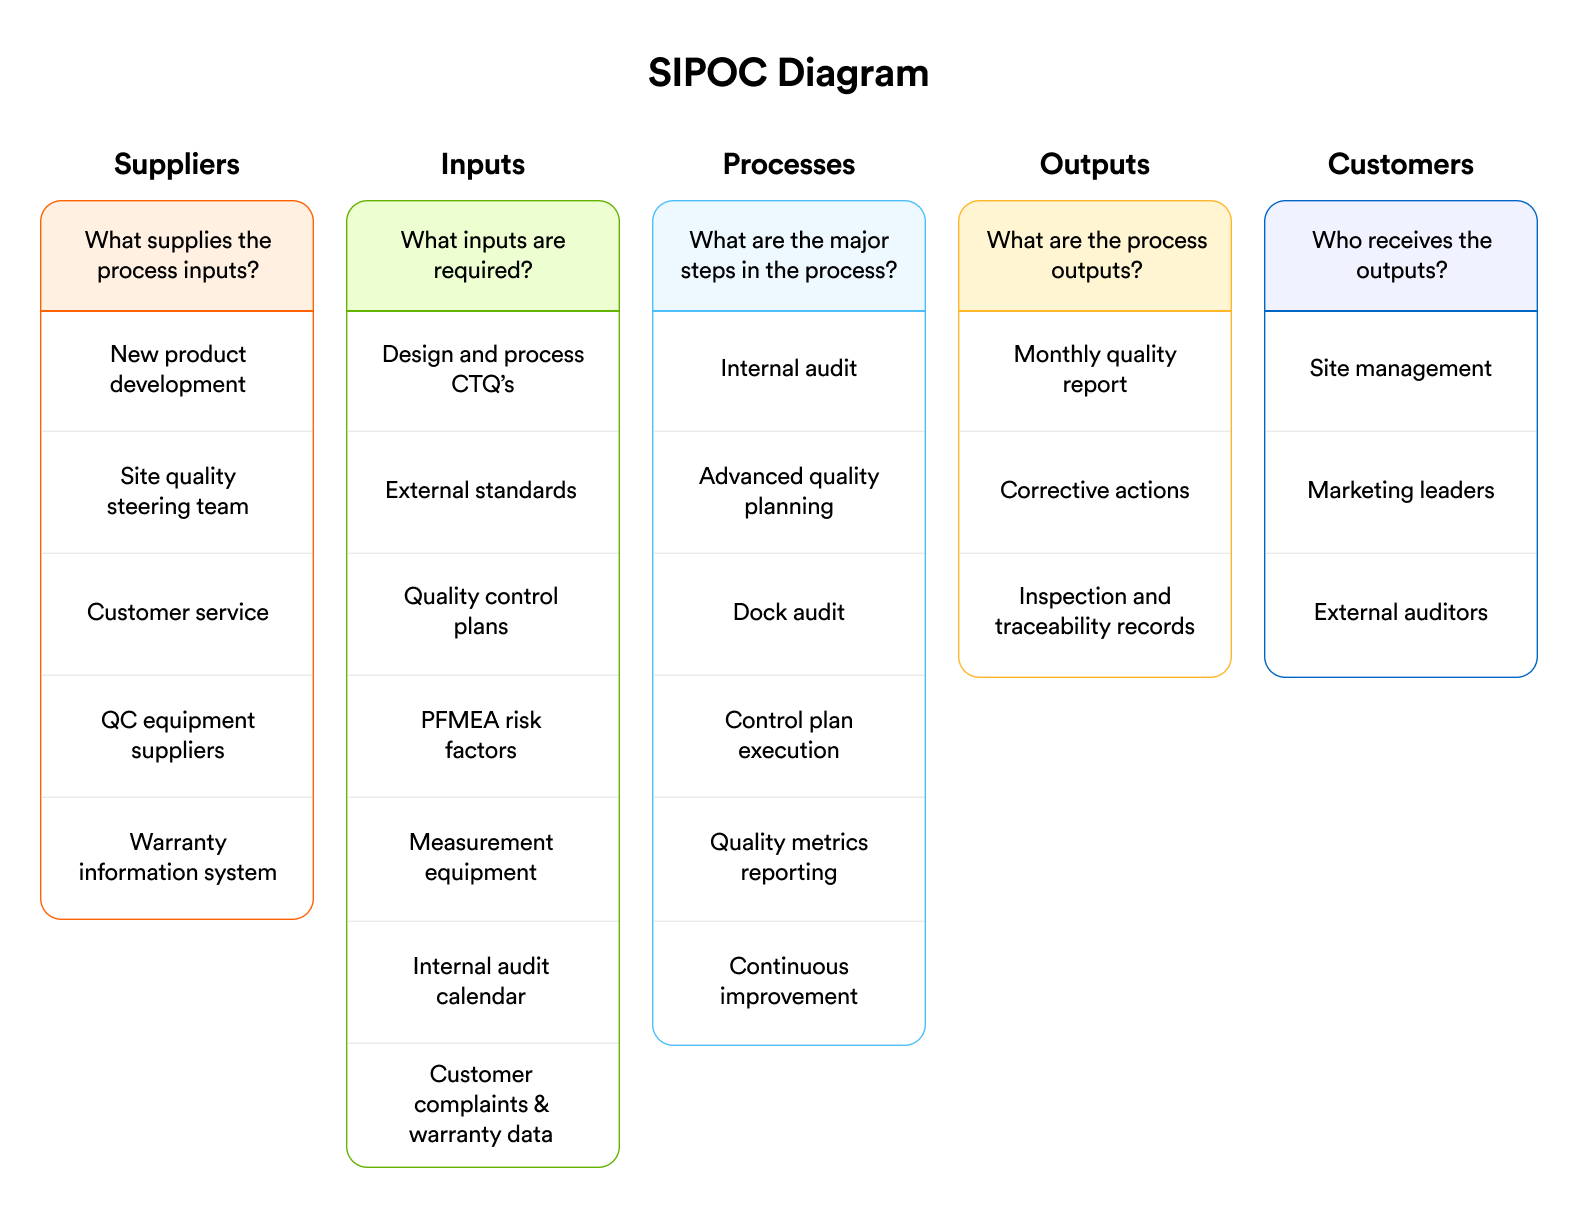
SIPOC diagrams are another widely popular form of business process mapping. While it’s a version of a high-level map in its own right, it can also contain basic linear maps within it — particularly in its “process” section. It’s a handy tool that specifies roles and responsibilities by category and relationship to the process.
Take this example, which shows the suppliers, inputs, processes, outputs, and customers involved in the maintenance of site quality. Each column asks a concise question to determine what is needed at each stage, promoting visibility across the entire organization.
Swimlanes mapping
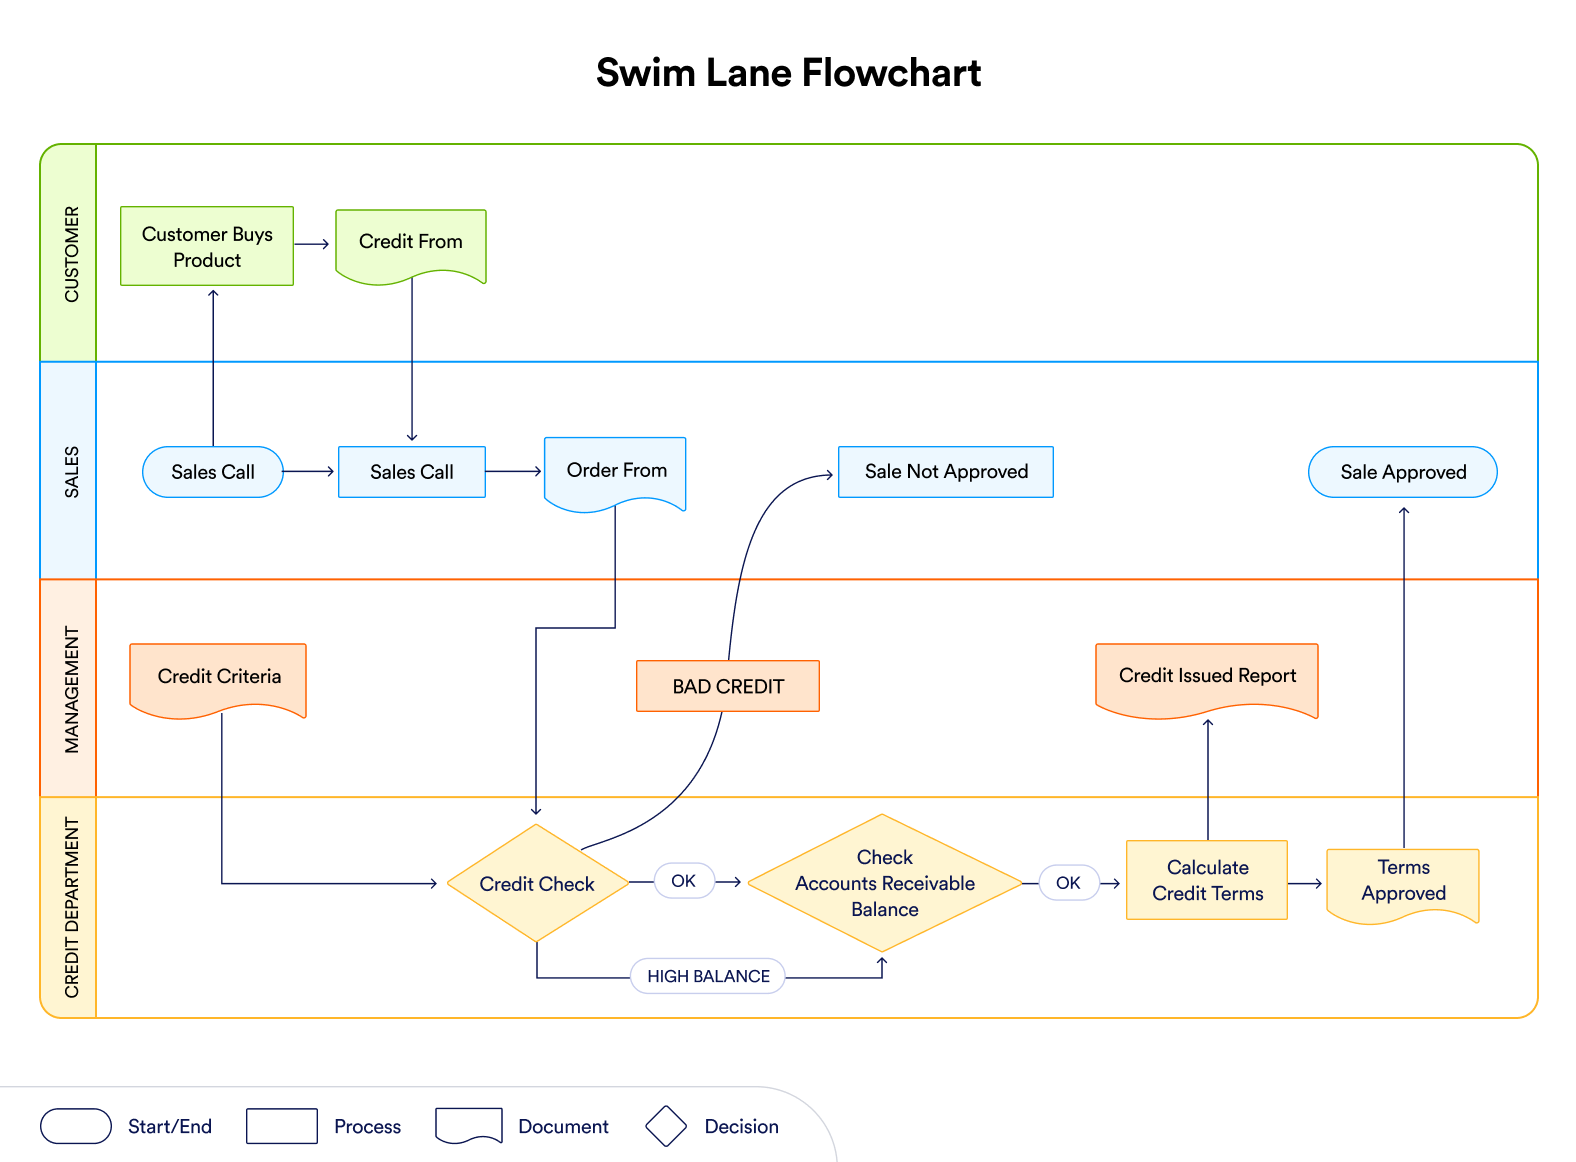
Swimlanes are a more advanced version of process mapping — they help to identify who does what chronologically within the process.
They take their name from the horizontal bars (or swim lanes) used to show the flow of the task over time. Much like a SIPOC diagram, they show the steps needed from different departments in order to complete a process. For example, see this swimlane showing how a number of teams must work together in order to approve a customer’s credit.
Kanban swimlanes
You can also integrate swimlanes with kanban boards, the main feature of which being columns that indicate how close a task is to completion. These columns and rows break the task into specific phases, for example showing what tasks are “in progress”, or indicating where teams may still be “waiting” for information.
With each task being broken down both vertically and horizontally, think of kanban swimlanes as a helpful one-two punch in organizational management.
Value stream mapping
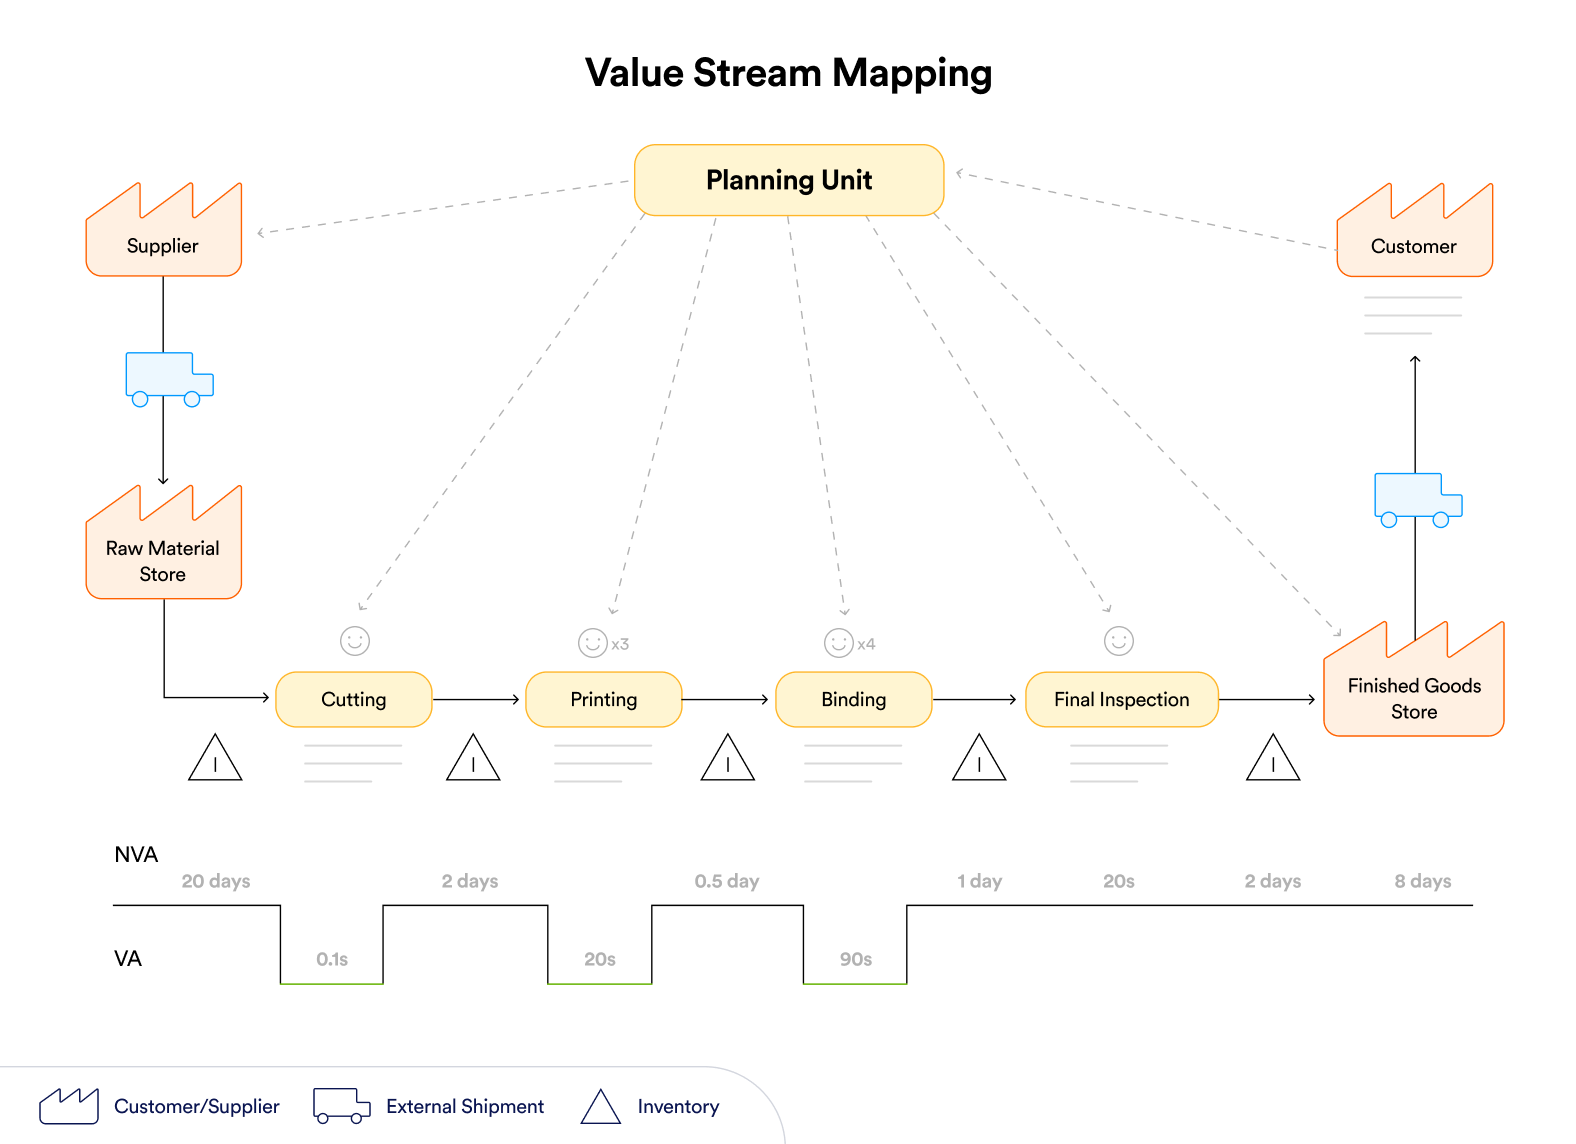
Considered one of the more involved types of business process mapping, value stream maps provide a quantitative and performance-centric approach to creating and studying your workflows. These maps use relatively simple symbols with three distinct layers, which could vary based on the circumstances:
- Information flow: The channel and steps in which information proceeds over the workflow.
- Materials flow: The movement of materials along the workflow, based on what’s known from the flow of information.
- Lead timeline: The time passed between phases of each flow.
The point of value stream mapping is to find wasted time in the movement of either information or materials within your company. In a best-case scenario, it should allow you to measure the value each specific function process brings to your business, and amplify the productivity of these functions.
Create a process map with Jotform
Whatever type of process map best fits your business, creating and deploying one with Jotform takes just a few clicks. Simply choose a pre-existing template, or create a bespoke one from scratch, and then customize as needed.
Process mapping techniques and technologies
By now, you’re probably eager to start building your own process maps. And the first step is to review some of the essential process mapping techniques that can help you maximize efficiency and productivity:
- Group discovery: To understand what’s going on in your organization, you need to ask the people in it. Conduct individual or group sessions with your team in order to learn about their current processes, what’s working, and what their key pain points are. You might even go one step further by organizing a multiday workshop to facilitate brainstorming and detailed feedback.
- Monitor real-time processes: This tactic tends to work best in a physical workplace, like a retail store or factory floor — for example, by observing your team restocking shelves — however this can also be done with digital tools, like Asana and Harvest.
- Reference existing documents: If your company keeps detailed records, this quick step could have long-term pay off. Review the existing processes you have in place, like an onboarding guide for a new starter, in order to make note of the efficiencies and inefficiencies. For example, you may find that an onboarding step has been repeated, helping you refine the process through future mapping.
The best process mapping technologies
With so many tools available to translate your data into process maps, and manage the processes thereafter, finding the right one is key. Often these require little to no coding experience, so you can start implementing them in seconds.
Diagramming software
These tools can be useful for visualization, and should be capable of using the symbol maps and diagramming languages like standard process mapping and BPMN.
Keep in mind what types of diagrams will best serve your business as you grow — for example, do you find kanban swimlanes more useful, or prefer the detail of value stream maps? Then choose a tool that corresponds to your needs. Some of the popular diagramming software examples are draw.io, Lucidchart, and Miro.
Process automation tools
Process mapping should make your business run more smoothly — and what could be smoother than automation? Use an automation tool to streamline approvals, send team notifications, or deal with invoices, freeing up your team to focus on what matters most. Popular process automation tool examples include ClickUp, Kissflow, and Jotform Workflows.
Project management software
While automation and diagramming tools work fine on their own, the real efficiency comes when they’re properly managed by a dedicated project manager. And to support that person, or team, they’ll need the right technology.
The capabilities of project management software often span well beyond just process mapping — they should apply to the tasks and projects guided by all your new charts, providing full organizational visibility. monday.com, Motion, and ClickUp are examples of widely used project management software.
With all this in mind, you should have a strong sense of what it takes to start to build maps of your own. But, before you start, read on for some real-world examples of process maps in action…
3 process mapping examples in action
Now that you have the tools to build these maps for yourself, let’s look at some of the best real-world examples where process mapping has improved efficiency.
Onboarding a new customer
A HubSpot report found that 68 percent of customers are willing to pay more to work with companies that value customer service — and the best customer teams are supported by comprehensive processes.
Let’s take this diagram from ProcessMaker as an example — it’s a typical high-level process map using the widely accepted BPMN symbology:
- The opening green circle indicates the company has received the request to create a customer account.
- A chain of operations occurs after this, using diamond icons to indicate where a decision or input is needed from a third party — for example, the customer may have requested specific product information.
- The closing red circle indicating the customer has been fully onboarded.
This map presents an ideal baseline for creating and customizing your own onboarding flow. For instance, you can expand the process into a swimlanes map if several of your departments are involved in customer onboarding.
IT ticket processing
Whenever your servers are down, your wifi starts acting up, or a device breaks, your IT department needs to know about it. But often, inefficiencies or broken lines of communication between teams can lead some workers to take matters into their own hands… and unknowingly put your organization at risk.
A recent survey by G2 found that 80 percent of workers admitted to using ‘shadow’ software that hadn’t been approved by the IT department — a simple act that dramatically increases the likelihood of a data breach or cyber attack. The easiest way to make sure that your IT team has the tools to action a request quickly is by implementing an efficient ticketing process.
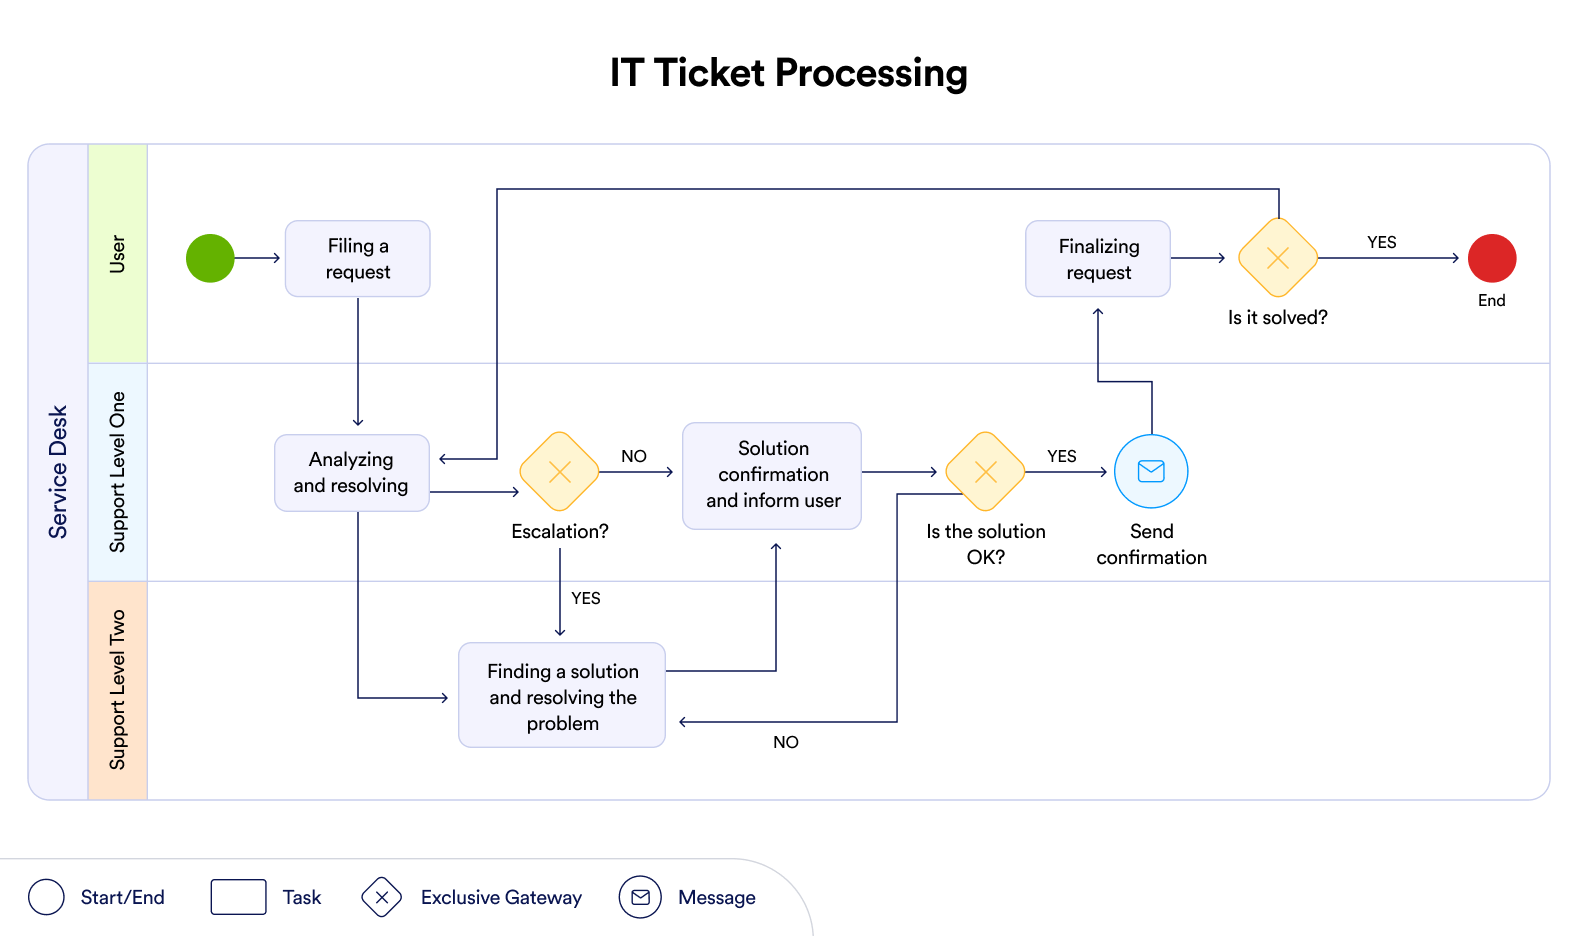
Here’s an example of a straightforward IT support process using a swimlanes process map, from Heflo.
- The initial user makes a request, signified by a green circle.
- The request reaches the first support level, the IT service desk, for analysis and resolution.
- If need be, the problem is escalated to the second support level, indicating more specialised IT technicians.
- Once the problem is resolved, the initial user is notified via a confirmation email and the process comes to an end.
These ticketing requests give some autonomy to the initial user, allowing them to confirm if their needs have been met, while IT can show they’ve made themselves fully available to handle the request.
Project management process
While streamlining individual processes undoubtedly makes for a smoother experience across departments, the biggest benefactors are project managers.
Despite needing visibility across the whole of an organization, project management is commonly overlooked — with only 23 percent of companies using standardized procedures. So don’t let your company become part of this statistic.
Take a look at this project management diagram from Lucidchart.
- This simple linear workflow starts with assembling a team and aligning your project objectives.
- The only non-linear element involves the manager themselves reviewing the final phases of the project. Though this could also involve external stakeholders.
- The project comes to an end.
Now that we’ve seen a variety of real-world maps, and you can appreciate their value in your organization, you’re ready to start building maps of your own. In the next chapter, we’ll explore how to start process mapping from scratch using all the information we’ve gathered so far.
How to build a process map
After reviewing the various types of diagrams, understanding the methodologies and techniques to build them, and seeing some real-world examples, you can start building maps of your own.
7 steps to building a process map
- Identify the problem: Ask yourself, or your staff, where they have seen slowdowns, what their pain points are, and if they’re repeating tasks unnecessarily. From there you can decide what needs streamlining with a process map.
- Figure out the key steps: With a task or process in mind, the next step is to brainstorm with your teams and departments or whoever else is involved in the project. This step happens before you start drawing the map — when you want to understand how the process currently runs and how to deal with bottlenecks.
- Establish the endpoints: Decide what or who needs to be involved in order to sign off a process, then mark these with BPMN to end the workflow.
- Fill in the sequences: With your goalposts in place, you have a clear path to map through. Remember, this step shouldn’t be a simple regurgitation of what you learned in the “key steps” phase — each stage should be tailored to your organization.
- Conduct a test run: Have your team follow the new process map to see if the steps you envisioned work how you hoped they would — then make any changes accordingly.
- Confirm the final map: You’ll know you’ve succeeded if your team reports a shorter completion window and an easier overall process with tasks and workflows.
- Improve as you go: Just because a process map is complete doesn’t mean the hard work is over. Company growth, department budget cuts, and new software can quickly render your new map outdated and unhelpful. Always be willing to revisit and revise your map so it doesn’t get in the way of progress.
Finding the best process map training resources
Though we’ve tackled the foundational elements of plotting out your diagrams, you may want to invest in a more advanced training course to expand your process mapping knowledge. This training is essential if you want to create and manage larger maps with more detailed terminology as your company grows.
Before diving into the first resource you find, ask yourself a few questions about what you’re hoping to achieve through further training:
- How far along are you in developing your process maps?
- Do you prefer live instruction or pre-recorded online courses?
- How complex do you need the training to be?
- Beyond process mapping, how interested are you in learning more about process management?
- What’s your budget for these resources?
- Do you need individual training or group courses?
- What are your long-term process management goals?
5 best process mapping training resources
Here’s a list of some of the most comprehensive free, freemium, and paid training resources currently on the market:
1. Lucidchart
Lucidchart has an entire learning campus set of resources, including interactive training labs and customizable templates.
2. Skillshare
Skillshare offers a beginner video course that walks through the building of process maps across a handful of categories. This course also includes access to an instructor and a community of other students.
3. Udemy
Udemy provides an online masterclass in process mapping that offers certification and options for group sign-ups for your employees.
4. Kissflow Academy
Kissflow Academy expands on process mapping education, offering certifications in workflow development, case management, and project management.
5. Villanova University
Villanova University offers a multiweek course for certification in business process management. This expands on process mapping into lean management and professional techniques like Six Sigma.
With this information, you should have the necessary tools to map out your first basic maps for tackling your administrative tasks and processes. Now, we’ll dive into how you can leverage Jotform to automate many process mapping elements as effectively as possible.
Process mapping with Jotform
As a business leader, you should always be striving for ways to boost efficiency — and one of the key tools to unlocking this is automation.
This isn’t the type of automation that’s replacing jobs or taking creative tasks away from workers. These are mundane, repetitive duties that only distract from the more critical work your employees could be doing. A report by the McKinsey Global Institute found that 64 percent of data collection and 69 percent of data processing tasks could benefit from automation — and in turn, this could lead to global productive growth of up to 1.4 percent annually.
Process mapping is just one of the ways you can implement automation today. And with hundreds of templates to choose from with Jotform, a more productive workforce is just a few clicks away.
Automate workflows with Jotform
Rather than simply creating a process map that spells out the order of tasks in a workflow, make them interactive and actionable, with Jotform Workflows.
Whether you’re customizing a template to onboard new clients, approve budgets, purchase orders, or manage vacation requests, Jotform Workflows makes this process easy, allowing you to
- Choose from over 10,000 customizable form templates through the drag-and-drop interface.
- Set up conditions that direct the flow each form takes through the approval process, so only the right decision-makers can approve or reject forms.
- Automate notification emails to tell decision-makers when they need to make an approval.
- Use Jotform Tables to view and analyze submissions.
- Fill and approve forms on the Jotform Mobile Forms App. Once you build and test the process, you’ve completed your process map — and automated it to boot.
The best part? You can build and manage these process maps for free. Start streamlining your organization with Jotform today.
How to find us
- Website: www.jotform.com
- 24/7 customer support team: www.jotform.com/contact
- @Jotform on X and Facebook
- @Jotform_Official on Instagram
Photo by UX Indonesia on Unsplash







Send Comment: